
- St. Olaf News
- Features
- For the Media
- Media Relations
- Kari VanDerVeen
- Alumni Hall
- 507-786-3970 office
- 507-412-1036 cell
- vanderve@stolaf.edu
 RSS Feed
You reached this page through the archive. Click here to return to the archive.
Note: This article is over a year old and information contained in it may no longer be accurate. Please use the contact information in the lower-left corner to verify any information in this article.
Where math meets politics
December 12, 2012
 More than a million ads were aired during this year's presidential campaign, shattering previous records and inundating the airwaves in battleground states.
And Erika Franklin Fowler '00 kept track of them all through her role as co-director of the Wesleyan Media Project.
Since the 2010 election cycle, the Wesleyan Media Project has tracked and analyzed broadcast advertisements aired by or on behalf of state and federal election candidates in all media markets. The data from the project has been cited in every major media source, with Fowler herself appearing on NPR and PBS Frontline and in the New York Times.
The Wesleyan Media Project is a continuation of a project that began at the University of Wisconsin, where Fowler earned her doctorate. One of her faculty advisors there directed the Wisconsin Advertising Project's tracking from 2000 to 2008. When he moved on to other things, Fowler and several others took the reins.
The project eventually moved to Wesleyan University, where Fowler is also an assistant professor of government. In collaboration with Bowdoin College and Washington State University, Fowler's team, which has been funded by a number of national organizations, is working to develop a definitive database that tracks all advertising by source.
Fowler, a political science and mathematics major at St. Olaf College, shares how her group keeps track of it all, the most surprising data to emerge from this year's election, and what's next for the project.
What has been the most surprising or interesting fact about campaign ads that the Wesleyan Media Project has revealed?
There were many surprises in 2012. Contrary to most expectations, the heavy involvement and deep pockets of GOP interest groups in the presidential race did not amount to an advantage for Romney. In fact, Obama out-advertised him in most battleground markets for the majority of the campaign. The other amazing thing is that despite 2012 being a record pulverizing year for political advertising, it was also a year that saw the presidential battleground shrink. Specifically, there were many more ads crammed into many fewer markets this year, which means that those who live in the battleground markets were inundated like never before and much of the country saw few, if any, presidential ads.
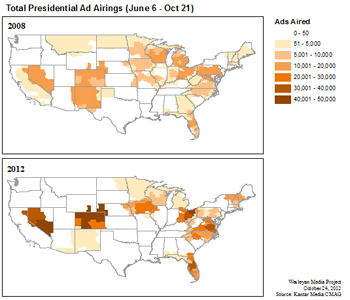 |
| This graph prepared by the Wesleyan Media Project, co-directed by Erika Franklin Fowler '00, illustrates that more ads were placed in fewer markets during this year's presidential campaign compared to 2008. |
More than a million ads were aired during this year's presidential race, shattering the records of previous races. How does your group keep track of it all?
We purchase the tracking data from a commercial company, which collects the videos and frequency information that tells us when and where an ad aired and approximately how much it cost. We then use a custom-built software application (built by my husband, fellow Ole James Fowler '00) that facilitates our analysis of the video data. Specifically, the online interface allows all of our student coders from the three partner institutions to log on from anywhere with an Internet connection and access their randomly assigned queue of ads. They then view each ad and answer a host of questions about the content, including tone, sponsor, issues mentioned, etc. We then merge all of the content data with the frequency data to be able to provide information on who is trying to influence elections in which markets and what they are saying.
What was the most positive ad you came across (if there were any)?
This was the most negative presidential air war of the four for which we have tracking data (back to 2000), which was not surprising nor necessarily bad for democracy. In fact, there is a lot of evidence in political science demonstrating that negative ads not only contain more substantive information than positive ads but also may encourage citizens to become more informed. So positivity this cycle was definitely few and far between. I’m not sure I could single out one as 'most' positive (we don't rate the levels of tone beyond simply noting that it is positive), but I will say that I am surprised Romney didn’t take more opportunities to introduce himself to voters through positive ads early on. Much like John Kerry before him, Romney may have missed the opportunity to define himself before he was defined by his opposition.
After all this, can you still watch TV?
I did take a little break from the news after the election, but to be honest, I enjoy seeing what's being covered and what ads are airing even outside of election season. There are a lot of energy issue ads out right now, which is interesting.
What's next?
We are starting to work on the academic papers, where we combine our content data with surveys and experiments to assess the influence of advertising on citizen opinions and behavior. In addition, we are also working on ways to extend the project into other subject areas.