Absract
Water. It is one of the few chemicals required to sustain life and an abundant resource frequently described by Nicollet and Geyer during the 1838 Undine Expedition. When people perceive water resources to be in abundance, the resource itself can become transparent – people are simply less aware of it. In a state with 92,000+ miles of streams and over 11,000 lakes, how can surface water quality be an issue? Few take time to appreciate how changes made to the landscape impact water quality. As part of this project we are exploring changes to surface water quality by taking chemical “snapshots” of the present and working to discover caches of historic data that provide other chemical snapshots in time. Not only does this provide insight into the changes in surface water quality, but it also asks us to consider just how much we know about surface water resources in Southern Minnesota and Northwest Iowa.
 |
 |
 |
 |
 |
 |
 |
 |
 |
Water Quality Indicators
In addition to the habitat surface waters provide to terrestrial and aquatic organisms a lake or river contains a diverse set of ions and molecules emanating from the weathering of soil and rock, the atmosphere, the riverbed or lake bottom, direct discharges, and surface run-off from within the watershed. Climate and basin morphology provides the fundamental drivers for a water body’s chemical composition; however, humans can and have profoundly influenced water chemistry. Soil disturbance, including vegetation removal, leads to increased rates of leaching and erosion as well as higher run-off velocities. Micronutrients, nitrogen and phosphorous, and sodium and potassium ions result from fertilizer application, wastewater discharges and stormwater run-off. Highways and parking lots contribute oils and metals.
Other chemicals affecting water chemistry come from fossil-fuel combustion (motorized vehicles, electric utilities and industry), and facets of daily living. Some of these chemicals are well-known persistent environmental pollutants, e.g., polycyclic aromatic hydrocarbons, herbicides, and pesticides. Others are more obscure and arise from use of personal care products, biocides, and pharmaceuticals. In 2002 the USGS published a chemical reconnaissance of 139 surface water streams, and a surprising number of pharmaceuticals and other organic contaminants were found -- including caffeine and DEET -- in roughly two-thirds of all samples. In addition to profiling specific sites along Nicollet’s route for caffeine, other water quality measurements will be conducted related to turbidity/transparency (murkiness), pH (acid-base character), and conductivity (dissolved ion content). In addition to conducting our own chemical analysis, we have searched historic records kept by the state and federal government as well as other organizations.
Turbidity & Transparency
The ability to see any depth in water or for sunlight to penetrate into water is modified by the presence of suspended matter, which causes light to be scattered and absorbed rather than transmitted. Materials, such as, clay, silt, carbonate particles, plankton, algae, fine organic particulates, small organisms, and dissolved substances all contribute to water’s apparent turbidity. While actual turbidity measurements can be challenging to execute in the field, measuring transparency based on light reflecting off a white or patterned disc is much easier to accomplish.
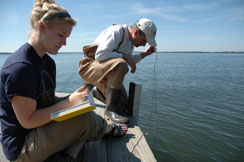
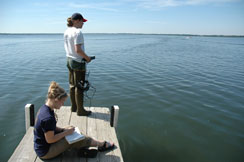
Secchi Disc. A simple method, comprised of a weighted, white or white/black 20 cm diameter disc attached to a calibrated rope, is used to probe the transparency characterizes of lakes. As the disc is lowered into the water light reflects off the surface of the disc and is impacted by the absorption and scattering characteristics of the water and substances dissolved or suspended in it. The depth at which the disc or its pattern can no longer be seen is recorded. Typically, the average of readings made while lowering and retrieving the disc is reported as the secchi depth. Secchi depths range from a few centimeters to over 40 meters in very clear, deep lakes. In the upper Midwest readings range between 0.25 m and 10 m.
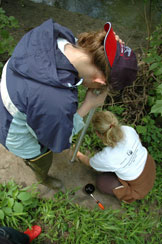
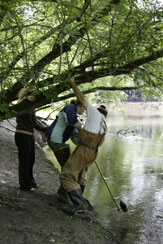
Transparency Tube. Moving waters found in streams and rivers provide a greater challenge to measuring transparency. For these measurements citizens and scientists employ a transparency tube, a clear, 100 cm x 4.5 cm plastic tube equipped with a release valve and a small white/black patterned stopper. The same absorption and scattering principles, as in the secchi disc method, apply to visualizing the patterned stopper. Water collected from a bucket in the upstream direction of the river is poured into the tube. A clamp on lower outlet of the tube is loosened and the water height at which an individual can see the patterned disc through the water column is recorded. Typically three replicates are averaged to yield a transparency tube result.
Salinity
This term represents the sum concentrations of all ions dissolved in water and is expressed as total ion concentration, mg/L. In fresh water systems the ionic composition is dominated by chemistry associated with bicarbonates, carbonates, sulfates and chlorides as well as calcium, magnesium, sodium and potassium. For practical purposes the total ionic salinity sums the concentrations of Ca2+, Mg2+, Na+, K+, HCO3-, CO32-, SO42-, and Cl-.
Specific Conductance is a measure of resistance to electrical flow. In water electrical resistance decreases as ion concentration increases; consequently, pure water has the highest resistance to electrical flow. Measuring electrical resistance has been widely used in chemical study of water as a means to indicate changes in ionic composition. Conductance is expressed in mSiemens per centimeter (the reciprocal of specific resistance of a solution measured between two electrodes 1 cm2 in area and 1 cm apart). Fresh water systems give specific conductance values between 0 and 1300 mS/cm. Our team uses a submersible conductivity cell connected to a YSI 30 Conductivity meter that autoranges and compensates to 25 ºC.
pH
The acid-base character of water is extremely important to living organisms and is captured by measuring the concentration of hydronium ions (think hydrogen ion, H+). The actual concentration is represented as decimal numbers via a log function.
pH = -log[H3O+]
A pH = 7 represents a balanced acid-base character, namely a neutral solution. Solutions having a pH < 7 are acidic and those with pH > 7 are basic. Most organisms thrive in environments with 5.5 < pH < 8.5. Many lakes and streams in the upper Midwest are rich in carbonate and are consequently slightly basic. Our team uses a YSI 60 pH meter with a submersible combination electrode to measure the acid-base character of water.
Water Sample Collection
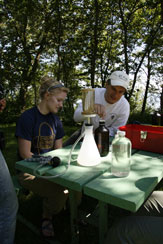
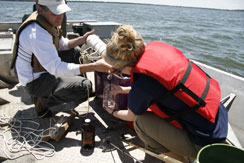
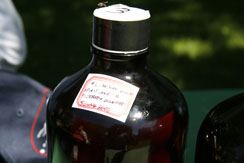
Chemical analysis for herbicides, pesticides, pharmaceuticals, and personal care products requires collection of a water sample for processing in the laboratory. Lake water samples were collected by means of a 2.2-liter horizontal water sampler held at mid-depth. River water samples were collected at mid-depth by means of a grab sampler equipped with a 1-L amber glass bottle placed directly upstream of the sampling site. Water samples were stored at 4 °C and transferred to the laboratory for immediate processing or filtered on-site through glass fiber filters, stored at 4 °C and transferred to the laboratory in 1-L amber glass bottles. Samples for metal analysis were acidified to pH 2 prior to transfer to the laboratory.
Units
Length
1 m = 100 cm = 39.37 in= 3.28 ft
1 km = 1000 m = 0.62 miles
Volume
1 L = 1000 mL = 1.06 qt = 0.264 gal = 33.81 fl oz
Mass
1 kg = 1000 g = 2.20 lb
1 lb = 16 oz = 453.6 g
Concentration
1 ppm = 1 mg/L = 1 mg/mL
1 ppb = 1 mg/L = 1 ng/mL