In-class notes for 02/26/2014
CS 121B (CS1), Spring 2014
Quiz today
For homework: Submit code through email, instead of screenshots, except for visual data such as images and drawings.
Submitted questions on assignments and technology
Upcoming
Submitted questions on readings
Manipulating images
The
cImagePython3 package (installed on Link machines and in the book's Active Code system) allows us to manipulate computer images.Review of image basics (text reference): image files; pixels; width, height; colors, intensities 0-255.
Using
cImageon the Link computers% cp ~cs121/stomag.png . % display stomag.png

% python3
Python 3.3.2 (default, Nov  8 2013, 13:38:57)
[GCC 4.8.2 20131017 (Red Hat 4.8.2-1)] on linux
Type "help", "copyright", "credits" or "license" for more information.
>>> import cImage as image
>>> img = image.Image("stomag.png")
>>> img.getHeight()
459
>>> img.getWidth()
687
>>> win = image.ImageWin()
>>> img.draw(win)
>>> img.getPixel(100,250)
(88, 183, 119)
>>> img.setPixel(100,250,image.Pixel(0,0,0))
>>> img.setPixel(100,251,image.Pixel(0,0,0))
>>> img.setPixel(100,252,image.Pixel(0,0,0))
>>> img.draw(win)
>>> img.save("stomag2.png")
>>> exit()
% display stomag2.png
Colors
Each pixel in an image has three color intensities, typically for the colors red, green, and blue, with intensity values ranging from 0 to 255. Each color that can the screen can display can be represented using combined intensities of those three colors. Examples:

For instance, the color teal has intensities (2, 147, 134), representing red=2 (on a scale from 0 to 255), green=147, and blue=134. The higher the intensity, the more light of that color appears.Note: The same intensity values will appear somewhat differently on different screens, especially screens that are manufactured using different technologies. We will not look into correcting for such discrepancies here.
The maximum intensity triple (255, 255, 255) displays as white, and the minimum intensity triple (0, 0, 0) displays as black.
The red/greenblue strategy we describe here is called a color model, and is commonly called the RGB model.
Other color models exist. Whereas RGB works well for computer displays (which generate light), another model called CYMK works better for print media (which reflect light). The CYMK model is based on ink colors cyan, yellow, magenta, and black.
Comment: Using red, green, and blue intensities, e.g., (2,147,134), is a natural way to specify an RGB color. Alternatively, an approach called HSV (hue-saturation-value) exists, which describes the RGB colors using a different strategy besides specifying three intensities.
We will not use HSV in our work, but instead will specify colors using three intensities between 0 and 255, for red, green, and blue.
Example of manipulating an image
Consider the following problem:
Write and test a function
negative()to replace each pixel color in an impage by its negative color, satisfying the following spec.negative-
One argument: A
cImageimage. - State change:
- The image arg1 is modified to replace each pixel color by
its negative color, i.e., replacing the red
intensity
rdby 255 -rd, replacing the green intensitygrby 255 -gr, and replacing the blue intensityblby 255 -bl. -
Return: A
cImageimage, the modified version of arg1 with all pixel colors replaced by their negatives
import cImage as image win = image.ImageWin() img = image.Image("stomag.png") img.draw(win) # shows the image before modification img = negative(img) img.draw(win) # shows the image after modification-
One argument: A
We will define the function
negative()using a nested loop (loop within a loop) to visit all the pixels in each row and column of an imageimg.for row in range(img.getHeight()): for col in range(img.getWidth()): Do something with the pixel at (row, col)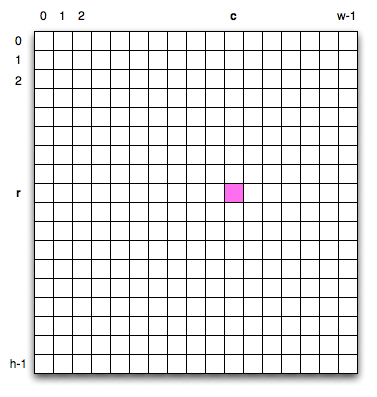
Definition of
negative():import cImage as image def negative(img): for row in range(img.getHeight()): for col in range(img.getWidth()): pixel = img.getPixel(col, row) red = pixel[0] green = pixel[1] blue = pixel[2] img.setPixel(col, row, image.Pixel(255-red, 255-green, 255-blue)) return img def main(): win = image.ImageWin() img = image.Image("stomag.png") img.draw(win) # shows the image before modification img = negative(img) img.draw(win) # shows the image after modification img.save("stomag_negative.png") win.exitonclick() main()Images:

Note: Use a function
main()for larger programs to make it easy to find the main algorithm of a program. Be sure to include a call ofmain()at the end of your code.
About lists
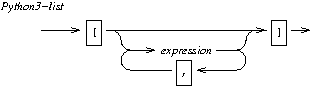
A Python3 list is a sequence of any Python3 values, referred to as elements, that Python3 treats as a unit, and whose elements can be modified. Python3 syntax for lists:
The length of a list is the number of elements in that list. The predefined Python3 function
len()may be used to determine the length of a list.Sample calls:
    len( ['a', 7, 42+19, math.sqrt(2)] ) --> 4
    len( [] ) --> 0
Individual elements in a list may be retrieved using index notation, which also uses square brackets. The index of a first element is zero. Example:
import math lis = ['a', 7, 42+19, math.sqrt(2)] lis --> ['a', 7, 61, 1.4142135623730951] lis[0] --> 'a' lis[3] --> 1.4142135623730951 lis[4] Traceback (most recent call last): File "The error message for", line 1, in lis[1:] --> [7, 61, 1.4142135623730951]lis[4] IndexError: list index out of range lis[4]arises becauselisonly has four elements, with indices 0, 1, 2, and 3. In other words, there is no element with index 4, causing the error.The final example above illustrates a slice of a list, producing of all elements of
liswith index 1 or greater. ThedrawSprigfunction uses indexing and slicing in order to manage drawing colors.
import turtle

window = turtle.Screen()
fred = turtle.Turtle();

def drawSprig(tu, length, factor, angle, colors):
    if colors != []:
        prevcolor = tu.pencolor()
        tu.pencolor(colors[0])
        tu.forward(length)
        tu.left(angle)
        drawSprig(tu, length*factor, factor, angle, colors[1:])
        tu.right(angle)
        drawSprig(tu, length*factor, factor, angle, colors[1:])
        tu.right(angle)
        drawSprig(tu, length*factor, factor, angle, colors[1:])
        tu.left(angle)
        tu.up()
        tu.backward(length)
        tu.down()
        tu.pencolor(prevcolor)

fred.left(30)
drawSprig(fred, 100, .5, 40,  ['black', 'green', 'blue', 'red'])
List elements may be any Python3 values--including lists. When a list L contains elements that are themselves nonempty lists, we say that L is a nested list. Example:
[4, [7, 'a', 6], [], [1, [2]]]
Note: This list has four elements, three of which are lists.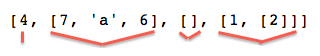
Lists that contain other non-empty lists are called nested lists.
Recursion
A function is recursive if it calls itself within its own definition. For example, the function
drawSprig()uses recursive calls in its definition in order to draw the next generation of each sprig figure.import turtle window = turtle.Screen() fred = turtle.Turtle(); def drawSprig(tu, length, factor, angle, colors): if colors != []: prevcolor = tu.pencolor() tu.pencolor(colors[0]) tu.forward(length) tu.left(angle) drawSprig(tu, length*factor, factor, angle, colors[1:]) tu.right(angle) drawSprig(tu, length*factor, factor, angle, colors[1:]) tu.right(angle) drawSprig(tu, length*factor, factor, angle, colors[1:]) tu.left(angle) tu.up() tu.backward(length) tu.down() tu.pencolor(prevcolor) fred.left(30) drawSprig(fred, 100, .5, 40, ['black', 'green', 'blue', 'red'])

< >