Project Description ![]()
We have completed the analysis of radar data acquired in the 1996-97 field season on Siple Dome, Antarctica. This project, in cooperation with the University of Washington (Glaciology) and the University of Colorado (NSIDC), has two objectives: to characterize the ice dynamics and history in the vicinity of Siple Dome as a part of investigations for a climate core, and to study recent changes in the configuration of ice stream drainage. In particular, we have examined the hypothesis that curvilinear scar-like features, first noted in satellite imagery, represent former ice stream margins. We have found that a prominent scar crossing the northeast flank of the dome represents a dynamic boundary, and confirms the notion that an ice stream formerly traversed the ridge now separating Ice Streams C and D. Similar scars in a splayed pattern called the 'Duckfoot' on the south side of the dome likewise depict a jump in the margin of Ice Stream C as the flow pattern changed in this area. These changes in drainage configuration are important to our understanding of the response of the Weat Antarctic Ice Sheet to environmental change.
Results & Data
Data sets from the project are available at the National Snow and Ice Data Center and include the ice surface elevation and subglacial bed elevation along the profile displayed below. Coordinates for the traverse are also provided. The data are available through a direct link: http://nsidc.org/data/nsidc-0085.html or by searching for "Jacobel" and "Siple" on the NSIDC website (in case the direct link has changed).
We have also produced contour and mesh maps of the
surface, bed topography, and prominent internal layers of the the Siple Dome
summit region in connection with siting and interpreting the climate core recently
drilled there.
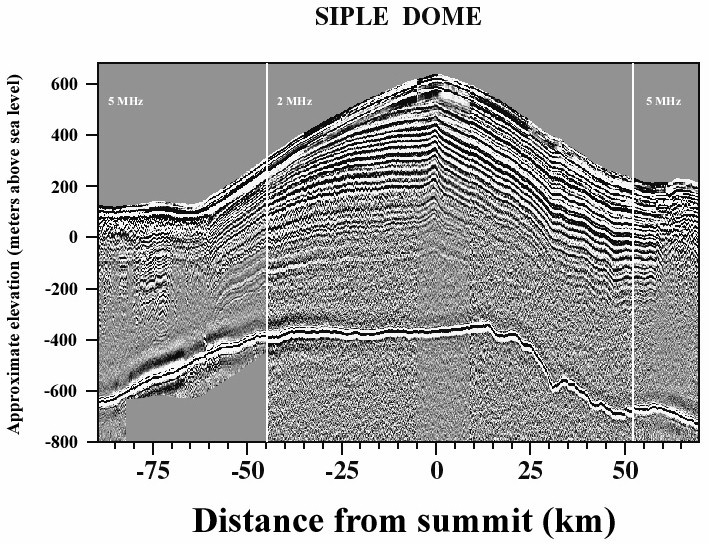
This image was created from a radar profile traversing Siple Dome, from ice stream C on the left, to ice stream D on the right. Radar signals are sent through the ice and are reflected back to a receiver. The glacial bed gives a strong echo that can easily be seen between 400 and 600 meters below sea level. Echos also arise from buried debris layers which depict flow deformation of the ice. These layers are easily seen in this image in the upper half of the ice sheet.