
Gantt Charts
by Corey Shelsta
If you have ever been involved in a construction project – the building or renovation of your theatre space, for instance – you have probably seen a Gantt chart. This type of chart is commonly used in project management to graphically illustrate the various tasks of a project over the time allotted.
The Gantt chart was developed in the 1890s by a Polish engineer named Karol Adamiecki to help better organize the processes at the steelworks he managed. His ideas of using this organizational technique were not published until 1931 however, and then they only appeared in Polish.
The chart as we know it was designed in the 1910s by Henry Gantt, an American mechanical engineer and management consultant. In its original form it showed various tasks assigned to each machine in a factory based on the time it took to complete them. With the start of World War One, Gantt was contracted as a consultant to the Army Ordnance Department by General William Crozier. Crozier had visited some of the factories employing Gantt’s techniques, and was looking for a way to better organize the production of arms and munitions that had swelled with the start of the war. Because of its success, the use of this style of chart was later adopted by many government agencies to track the progress of everything from the production of naval aircraft to large scale projects like the Hoover Dam and the Interstate Highway System.
Many of us who teach in or work in academic theatre find ourselves using two forms of organization. The first is the basic planner. Whether it’s a written planner, Google Calendar, Microsoft Outlook or any of the other calendars out there, we use these to track our appointments and commitments. While these are very useful for showing when something begins, a due date, an appointment, the opening night of a show, etc., their ability to show specific tasks and how they relate to each other is limited.
The other organizational format we use is the basic list of dates - a course syllabus or rehearsal schedule are good examples. This is an excellent way of showing all of the relevant tasks or completion dates for a single project (a class in the case of a syllabus) but can get very confusing when multiple tasks are added.
In my years working in theatre, I have seen little use of the Gantt chart despite its organizational value and applications to what we do when building our shows. In its simplest form a Gantt chart first lists what each activity is. This could be a list of each scenic unit in a show, each costume piece, the days assigned to a lighting hang, etc. Whatever it is you are wanting to organize.
The next step is to set a length of time for each task shown on the chart and select a beginning and ending date. This is where experience or ‘educated guessing’ comes in to the equation. Typically we can look to past experiences to guide us on our timeline. How long does it take to build and paint 14 flats? How long does it take to construct 8 ball gowns for Act 1 Scene 4?
Once all of our tasks are in place and our timelines set, the Gantt chart will show you what activities overlap other and by how much, as well as what must be done before another task can be completed. The Gantt chart is not intended to be a fixed document. If something is behind schedule or ahead of schedule, adjustments can be made to reflect this. In the days when these charts were made by hand, this could be tedious. Now it is easy to make the changes in Excel (or whatever software you are using) and hit the print button to create a new chart.
I have included a sample chart that we use for Prairie Repertory Theatre in the scene shop each summer. Like many summer theatres, we have a very tight build schedule: four shows in five weeks (we usually take the 4th of July weekend off). The chart shows each of our four shows, the dates construction and painting should begin, and the dates for load in of the show. Also indicated are days off, tech rehearsal and performance dates, as well as the shift to the next show. This chart is printed on a 36x24 sheet and displayed prominently in our shop. The carpenters have a clear idea of what needs to happen when. It also shows when we will be the busiest (when multiple tasks start overlapping) so we can plan for those times with extra crews or additional shifts. Our chart also lists the scenic designer and master carpenter for each show, so the carpenters know who to look for if they have questions.
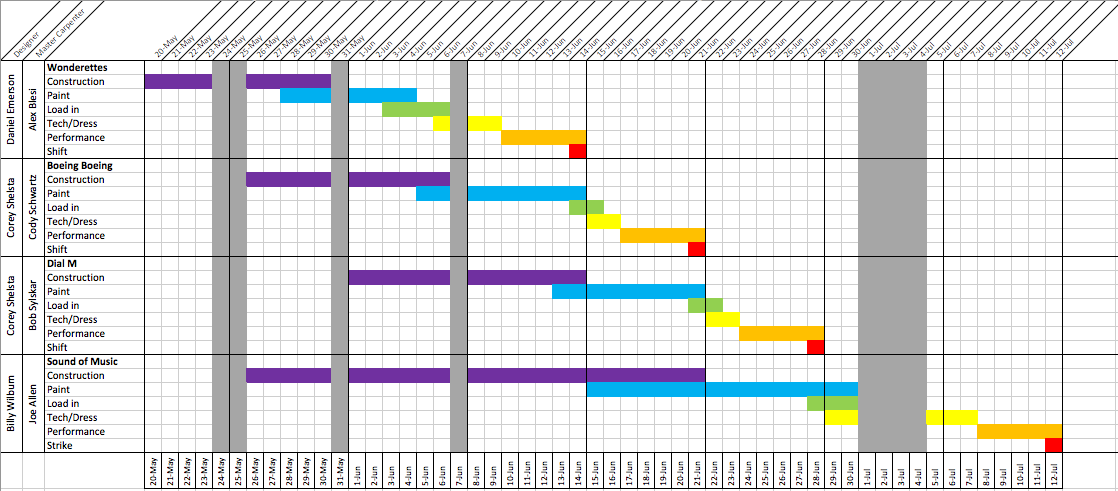
Gantt Chart
(click here for a PDF version. Here for an XLSX version)
While this chart is for the scene shop, similar charts could be made for costumes, props, lights, sound or any area you want to better organize. These area specific charts could then be combined into a master chart to track all of the areas. Charts can show an entire season of shows or provide scheduling details for a single production. Whether simple or complex, Gantt charts provide an easy to read method of timeline organization and can be a great asset in the construction of a show or the planning of a whole season.
https://www.officetimeline.com/gantt-chart-excel
http://www.gantt.com/
https://en.wikipedia.org/wiki/Gantt_chart
https://www.ablebits.com/office-addins-blog/2014/05/23/make-gantt-chart-excel/
https://templates.office.com/en-us/Project-timeline-TM00000005
http://www.vertex42.com/ExcelTemplates/excel-gantt-chart.html